
One of the most important advantages of online advertising is the measurability of their success. We are even more surprised when customers tell us that they receive no figures at all from many online portals, figures only on request by e-mail or some wild Excel tables.
For many portal providers, it is obviously not a standard procedure to provide customers with well-prepared key performance indicators.
At LUMITOS AG, we value sharing successes very highly with our customers. That’s why we provide every client with success indicators for each of their advertising measures, which they can access online at any time.
These LUMITOS success indicators are available once for each advertising measure and once as a summary of all the client’s advertising measures. A bird’s eye view, so to speak. The key performance indicators are always updated daily and show the following data:
- No. of visitors to the advertising campaign
- Average time spent on the advertising campaign
- Interactions with the advertising, e.g. bookmarking, sharing, video views
- Number of leads
- Clicks on the client’s website
- Number of telephone calls
- Development of visitors over time (trend line)
- Origin of visitors by country
- Origin of visitors by organization (company, university, institution)
- Overview of all GDPR-compliant leads incl. all data with additional download function as Excel spreadsheet
Graphical presentation of performance indicators
To make this enormous amount of data easy and clear for our customers to understand, we have prepared the LUMITOS key performance indicators in graphical form.
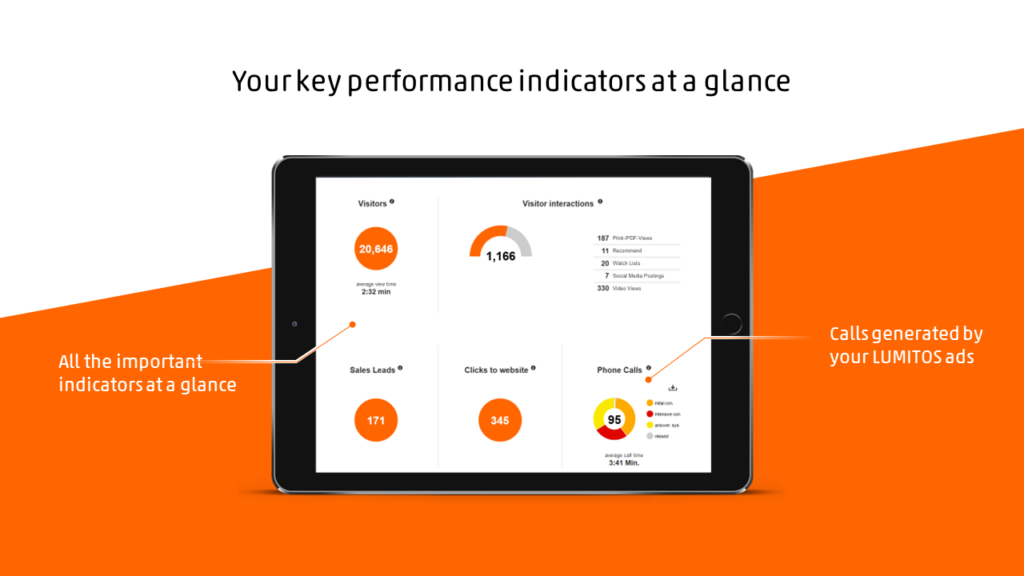
Key performance indicators: Easy-to-read presentation of the most important key figures
For example, we display the number of monthly visitors as a bar chart over time. We visualize information on the geographical origin of visitors as an interactive world map.
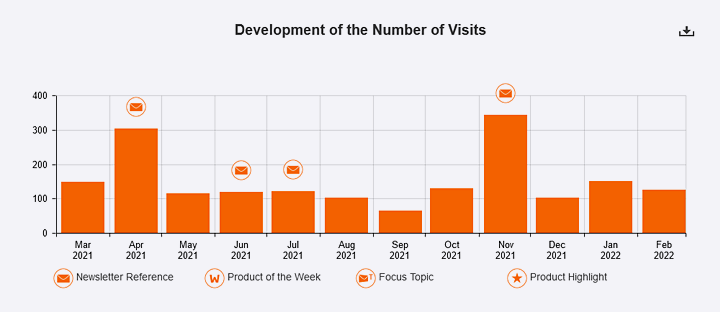
Bar chart: Successful product advertising for a laboratory device
Other information such as lead details or origin by organization is presented in tabular form.
Since every client has different questions and perspectives from which they would like to analyze and evaluate the success of their advertising measure, the LUMITOS success indicators also offer filters. For example, an individual date range can be specified.
The overall success indicators can also be grouped by type of advertising. For example, the successes of all white papers or all product advertisements can be displayed at a glance.
And of course, the LUMITOS success indicators can also be viewed with mobile devices.
Conclusion
With its structured performance indicators, LUMITOS offers success-oriented companies an effective way of keeping a constant eye on the success of their advertising measures.